|
|
|
||||||||||||||||||||||||||||||||||||||||||||||||||||||||||||||||||||||||||||||||||||||||||||||||||||||
|
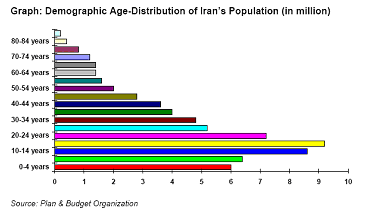
Population -The years
following the 1979 revolution saw a raprd increase in the population of
Iran. The latest official figures for the Iranian year that ended in March
2001 show that the annual growth has now been stabilized at about 1.1 %.
The present population size, provided by the Iran's Statistic Centre, is
about 65.5 million. (It is worth mentioning that the same statistic
estimated by the United Nation Information Centre surpasses 70 million;
though, when contacted, the UN said that they are currently studying the
discrepancy.) |
|||||||||||||||||||||||||||||||||||||||||||||||||||||||||||||||||||||||||||||||||||||||||||||||||||||||
|
|
|||||||||||||||||||||||||||||||||||||||||||||||||||||||||||||||||||||||||||||||||||||||||||||||||||||||
|
Graph: Demographic Age-Distribution of Iran's Population (in million)
|
|||||||||||||||||||||||||||||||||||||||||||||||||||||||||||||||||||||||||||||||||||||||||||||||||||||||
|
Urbanization -Another interesting development is the urbanization of the
country. Traditionally a rural society, Iran has developed into a modern
urban society over the past 30 years. In 1956, 69% of the population lived
in rural areas; today, 63% are urban dwellers and more than 50% of the
urban population has already grown up in an urban environment. With
urbanization, Iran is developing the need for modern systems and products,
among other things. |
|||||||||||||||||||||||||||||||||||||||||||||||||||||||||||||||||||||||||||||||||||||||||||||||||||||||
|
|||||||||||||||||||||||||||||||||||||||||||||||||||||||||||||||||||||||||||||||||||||||||||||||||||||||
|
Source: Plan & Budget Organization Ethnics -Iran's unique location at the crossroads of Arabia, Turkey and Central Asia has resulted in many ethnic groups being found within its borders. Just over half of the population is of Persian origin, while a quarter is Turkish-speaking Azeris of Azerbaijan. A large group of Kurds, and smaller minorities of Lors, Bakhtyaris, Arabs, Armenians, Turkmen and Baluchis also exist in certain regions. There are four main religions in Iran: Islam, Christianity, Judaism and Zoroastrianism.
Table: GDP Growth (1997-2001) |
|||||||||||||||||||||||||||||||||||||||||||||||||||||||||||||||||||||||||||||||||||||||||||||||||||||||
|
|||||||||||||||||||||||||||||||||||||||||||||||||||||||||||||||||||||||||||||||||||||||||||||||||||||||
|
Source: Central Bank 1 Using IMF weighted average rates of IRR 2,780 = USD $1.00 in 1997, IRR 3,206 = USD$1.00 in 1988, IRR 4, 172=USD$1.00 in 1999, IRR 5,731=USD$1.00 in 2000 and IRR 6,200=USD$1.00 IN 2001. The
following table sets out GDP in current prices and real GDP growth (using
the expenditure approach) and in percentage
terms for the period indicated: |
|||||||||||||||||||||||||||||||||||||||||||||||||||||||||||||||||||||||||||||||||||||||||||||||||||||||
|
|||||||||||||||||||||||||||||||||||||||||||||||||||||||||||||||||||||||||||||||||||||||||||||||||||||||
|
Source: Central Bank |
|||||||||||||||||||||||||||||||||||||||||||||||||||||||||||||||||||||||||||||||||||||||||||||||||||||||
|
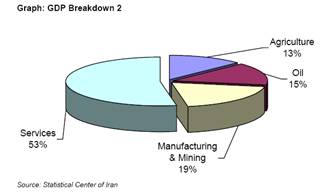
GDP Distribution -The structure of Iran's GDP continues
to be determined by its
reliance on oil. As the recipient of crude oil
revenues, the State remains the dominant
economic actor. The oil sector's share of GDP has
declined from between 30-40% in
the 1970s to between its more recent levels of 10 &
20%, principally as a result of
policy decisions taken at the time of the revolution to
reduce production and exports
and diversify the production base of the country as
well as a lack of investment in the
oil sector. However, oil revenue still provides
approximately 80% of export earnings
and nearly half of government revenue. As a result,
this sector is the prime recipient
of foreign
The table below presents the breakdown of service sector branches in the Iranian economy for 2001. Table: GDP Breakdown 3 |
|||||||||||||||||||||||||||||||||||||||||||||||||||||||||||||||||||||||||||||||||||||||||||||||||||||||
|
|||||||||||||||||||||||||||||||||||||||||||||||||||||||||||||||||||||||||||||||||||||||||||||||||||||||
|
Source:
Statistical Centre of Iran
The
following table shows Iran's GDP by economic sector in current prices and
by percentage contribution for the periods
indicated: |
|||||||||||||||||||||||||||||||||||||||||||||||||||||||||||||||||||||||||||||||||||||||||||||||||||||||
|
|||||||||||||||||||||||||||||||||||||||||||||||||||||||||||||||||||||||||||||||||||||||||||||||||||||||
|
Source:
Central Bank
In 1997,
real GDP rose by 3.4% reflecting a moderate increase in the non-oil sector
and a substantial decline in the oil sector as a result
of the decline in world oil prices. In 1998,
real GDP grew by 3.9% principally as a result of growth in the agriculture
and services sectors with oil recording only a small
increase and manufacturing and mining recording
nearly zero growth. In 1999, growth in real GDP was 1.6%. The
manufacturing and mining sector grew by 10.6% as a
result of increased construction activity and
the services sector grew by 3.8% as a result of an increase in
transportation, warehousing and communication. |
|||||||||||||||||||||||||||||||||||||||||||||||||||||||||||||||||||||||||||||||||||||||||||||||||||||||
|
|||||||||||||||||||||||||||||||||||||||||||||||||||||||||||||||||||||||||||||||||||||||||||||||||||||||
|
Source:
Central Bank
Growth rates in the oil sector have been
significantly impacted by changes in the price
of oil and the level of production as Iran
conforms to revised OPEC quotas from time
to time. In the non-oil sector State investment in
agriculture and wider production |
|||||||||||||||||||||||||||||||||||||||||||||||||||||||||||||||||||||||||||||||||||||||||||||||||||||||
|
|||||||||||||||||||||||||||||||||||||||||||||||||||||||||||||||||||||||||||||||||||||||||||||||||||||||
|
Source:
Central Bank
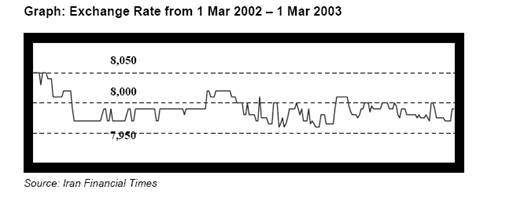
Unemployment -The unemployment rate for 2001 was 15.7%. The
unemployment rate is relatively higher among
females and, in recent years, in urban areas as opposed
to rural areas. It is very likely that the official
unemployment figures understate its Graph: Exchange Rate from 1 Mar 2002 -1 Mar 2003 |
|||||||||||||||||||||||||||||||||||||||||||||||||||||||||||||||||||||||||||||||||||||||||||||||||||||||
|
|
|||||||||||||||||||||||||||||||||||||||||||||||||||||||||||||||||||||||||||||||||||||||||||||||||||||||
|
|
|||||||||||||||||||||||||||||||||||||||||||||||||||||||||||||||||||||||||||||||||||||||||||||||||||||||
|
|||||||||||||||||||||||||||||||||||||||||||||||||||||||||||||||||||||||||||||||||||||||||||||||||||||||
|
3 Money
put aside, from the sales of higher that projected oil prices, to offset
future oil price fluctuations. Table: Price Index Break Down |
|||||||||||||||||||||||||||||||||||||||||||||||||||||||||||||||||||||||||||||||||||||||||||||||||||||||
|
|||||||||||||||||||||||||||||||||||||||||||||||||||||||||||||||||||||||||||||||||||||||||||||||||||||||
|
Subsidies -While the government has been relatively successful in
controlling prices, subsidies remain high with
approximately $5.5 billion allocated to basic commodities
and $10 billion to energy in 2002. Government Budget -The budgets (in billion Rials) for 2000 and 2001 and planned budget for 2002 are presented in the table below.
|
|||||||||||||||||||||||||||||||||||||||||||||||||||||||||||||||||||||||||||||||||||||||||||||||||||||||
|
|||||||||||||||||||||||||||||||||||||||||||||||||||||||||||||||||||||||||||||||||||||||||||||||||||||||
| In an effort to have a more transparent monetary policy, the Central Bank of Iran in 2002, for the first time, has outlined the budget complying with many of IMF's rules and standards. Up to the 2002 budget, domestic borrowing from the banking system, the issue of participation papers and oil pre-financing largely financed deficits. The two most significant sources of financing for 2002 deficit, however, are the Oil Stabilization Fund and privatization proceeds. | |||||||||||||||||||||||||||||||||||||||||||||||||||||||||||||||||||||||||||||||||||||||||||||||||||||||
|
Credit Rating On 10 May 2002 Fitch Ratings (UK) Ltd., the international rating agency, has assigned the Islamic Republic of Iran Long-term foreign currency and local currency ratings of 'B+' and a Short-term rating of 'B'. These ratings apply to senior unsecured debt issues of the Islamic Republic of Iran. The Outlook on the Long-term ratings is Stable. Related Press Release reads as follows: 'Iran is among the world's largest oil producers, and the economy has benefited markedly from higher prices over the past two years. In 2001 GDP grew by about 5% and the current account and fiscal surpluses are estimated at 5% and 3% of GDP, respectively. The current account has been in surplus for seven of the past eight years, leading to a continual accumulation of foreign exchange reserves, the establishment of an Oil Stabilization Fund (OSF) in 2000 and a steady reduction in gross external debt all with positive rating implications. As a share of GDP (7%) and foreign exchange receipts (CXR, 28%), Iran's external debt compares exceptionally well not only to its rating peers, but in fact to all sovereigns rated by Fitch. Only Taiwan (A+) has a lower debtfCXR ratio, and no sovereign has a lower ratio of debt to GDP. Iran's position as a large net external creditor is also one of its fundamental rating strengths, comparing favourably with other sub-investment rated sovereigns. Finally, in a major step forward in the economic reform process, the multiple exchange rate regime was discontinued in March 2002 in favour of a single rate determined in a new inter-bank market. Against these rating strengths, Iran faces serious rating weaknesses associated with the structure of the economy. State control extends to most 4 Does not include IRR 19,250 billions which have been earmarked by the government to compensate public sector entities which incurred external debt to fund public sector projects for the difference between the IRR 1,752 exchange rate (preferred rate that existed before 21 March 2002) at the date of contracting and the market rate at repayment in 2002 following exchange rate unification. Major industries, including banking where lending is directed to particular sectors, consistent with objectives outlined in the Five-Year Development Plan. The role of the state is also evident in an extensive subsidy system that costs the government an estimated 20% of GDP annually, although exchange rate unification should reduce subsidies and increase fiscal transparency. The oil sector generates 80% of export receipts and 50% of government revenues, exposing the economy to oil price volatility even with the OSF. Foreign exchange reserves of about USD15bn and an estimated OSF balance of USD9bn provide a sizeable short-term cushion. Diversification efforts have yielded few results and are not likely to succeed in the absence of foreign investment. Finally, mounting demographic pressures presage the need for large-scale employment generation, which does not appear forthcoming. The sovereign ratings are constrained primarily by the interaction of complex international and domestic political developments. Iran borders some of the world's most potentially volatile countries, and stakes in the region's geo- politics are exceptionally high. Tensions have heightened across the Middle East in recent months, reinforcing Fitch's view that international security issues and their implications for Iran remain unpredictable and prone to change quickly. Moreover, relations with the United States, which continues to impose strict bilateral economic sanctions, have deteriorated with the intensification of the Israeli-Palestinian conflict. Although US views on Iran are not necessarily shared by other members of the international community, Fitch believes they are a significant element of Iran's international risk profile. Domestic political risks centre on active debates between reformers and conservatives on the degree of political, social and economic liberalization that should be fostered within the Islamic Republic. Given the turbulent regional environment and the current US stance toward Iran, Fitch believes the reform debates could be affected by international developments, possibly prompting conservative elements to take an even less conciliatory approach, and there is a risk that this could be extended towards external credits. It should be noted, however, that Iran has had ongoing international commercial relationships in which debt payments have not been affected by domestic politics. Fitch does not judge domestic political risks to be a threat to the regime at present, but opines that reforms could be caught up in broader debates. Iran's first sovereign Eurobond in the amount of Euro 625 million, issued in July 2002 had at the date of issuance a yield of 8.95% and was heavily oversubscribed. The second Eurobond issued in December 2002 hat a coupon of 7.75%. With regards to Export Credit Agency (ECA) covered financing, the Club of Berne (coordinating the policies of all ECAs of the DECO region) has recently lowered Iran's country risk from category 5 to 4 (a rating of 7 is assigned to the highest risk countries) Foreign Investment Promotion and Protection Act Following months of dispute between the Parliament and Guardian Council, the Expediency Council ratified the final version of a new foreign investment law in Iran coined as the Foreign Investment Promotion and Protection Act ("FIPPA") on 26 May 2002. Under FIPPA and similar to the previous foreign investment law, commercial risks are not covered but any expropriation or nationalization will be compensated by the government. In some cases, if an act of the government disrupts the business activity, the government will be under obligation to make payments for any loan instalments that are due on behalf of the project company. The law also permits more options for repatriation of profits in hard currency combined with a broader definition of foreign investment. For the first time, project financing schemes such as buy back agreements and BOT projects (only under an operator status) are specifically covered under the foreign investment law. Conditions of FIPPA -Under FIPPA, any foreign natural or legal person - including Iranian expatriates -importing capital into Iran, enjoy the benefits and privileges of this law as long as: The investment leads to economic growth, promotes technology, promotes quality of products, increases employment opportunities, increases exports and assists Iran in entering the international markets. The investment does not jeopardize national security and public interests or harm the environment or disrupt national economy. The investment does not involve the granting of any special rights resulting in a monopoly. The value ratio of goods and services produced by aggregate of foreign investments does not exceed 25% in any economic sector and 35% in any economic sub-sector. FIPPA is applicable based on the nationality of the capital as opposed to the investor. As long as the capital comes from foreign sources, anyone importing it will be eligible for FIPPA protection including Iranians residing in Iran or abroad. Definition of Foreign Capital -For the purposes of the FIPPA, foreign capital is defined as: Sums in cash entering the country in the form of exchangeable currency though the Iranian banking system or other means approved by the Central Bank of the Islamic Republic of Iran. Equipment and machinery. Tools and spare parts, raw materials, manufacturing parts, additives and auxiliary material. Patent rights, technical know-how, trade names, trademarks and specialized services. Transferable dividends of stocks belonging to the Foreign Investor. Other authorized cases with the approval of the Council of Ministers. Types of Foreign Investment -FIPPA provides for two types for foreign investment which are protect able. These are: Foreign Investment in all sectors within the schemes of "civil partnership," "buy back," and "build, operation and transfer (BOT)" where the return of principal and profit arises solely through the activity of the same investment project and does not rely on any guarantee by the government, government companies or banks. Protections Available -Once an investment is authorized and registered under FIPPA, it enjoys full protection of the law including a sovereign guarantee in case of nationalization or taking. Article 9 of this law provides that: Foreign Investments shall not be deprived of ownership or nationalized unless for the public good, through a legal due process, in a non-discriminatory manner, and against payment of appropriate compensation based on the real value of the investment immediately before the appropriation. As indicated above, the compensation must be based on the "real value" of the investment and as such there has been inclusion of objective standards in determining what the compensation should be. This is a major shift from the previous 'LAPFI' requirement of "fair compensation" which left the door open to arbitrary and subjective treatment. A new protection provided in this law is the so called business disruption compensation by the government if it causes such disruption. In this regards, FIPPA provides: In the case of investments subject to Clause B of Article 3 of this Law [i.e. civil partnerships, Buybacks and BaTs as described above], should laws or government regulations lead to prohibition or cessation of approved financial agreements, then the government shall procure and pay the resulting damages with the ceiling being the matured and due instalments. Limits of the reimbursable undertakings according to this Law shall be approved by Council of Ministers. This means if any act of the government disrupts the investment company's activities it will have to make the payments for loan instalments while the disruption continues. It should be noted that this does not include commercial risks or changes in law that affect the profitability of the venture. Neither does this protection seem to apply in cases of direct foreign investment but rather it is applicable to project financing scenarios. An example of this protection would be where the government cuts the gas supply to a privately owned power plant as a result of which the operation ceases. During this time the government is obligated to make the payments for any loan instalments of the power plant. Finally, FIPPA has for the first time permitted -subject to restrictions -for resolution of conflicts other than Iranian courts. Article 19 of the FIPPA provides: Any disputes which may arise between Foreign Investors and the government over the reciprocal undertakings in the framework of investments mentioned in the present Law, and which can not be settled through negotiations, shall be examined by domestic courts of law, unless another mode of settlement of disputes has been agreed upon within a law on bilateral investment agreement with the government of the Foreign Investor. Based on the above, a foreign investor can seek arbitration only if there is a bilateral investment treaty between Iran and the country of the foreign investor. This is also subject to the Constitutional restriction as provided for in Article 139 where arbitration with the government and instrumentalities can only occur with the permission of the Parliament. Export of Capital -FIPPA provides legal permission for the foreign investor to export both its dividends and principal investment in hard currency. Article 13 of the FIPPA provides: The principal and interest of Foreign Capital or any portion of the capital remaining in Iran may be transferred abroad with a three-month notice to the Board upon fulfilment of all outstanding obligations, payment of legal deductions and the approval of the Board and confirmation of the Minister of Economy and Finance. Therefore, the Foreign Investor will be entitled to transfer in hard currency both the earned dividends of the investment as well as the principal amount imported into Iran. Based on the above, a foreign investor can seek arbitration only if there is a bilateral investment treaty between Iran and the country of the foreign investor. This is also subject to the Constitutional restriction as provided for in Article 139 where arbitration with the government and instrumentalities can only occur with the permission of the Parliament. Export of Capital -FIPPA provides legal permission for the foreign investor to export both its dividends and principal investment in hard currency. Article 13 of the FIPPA provides: The principal and interest of Foreign Capital or any portion of the capital remaining in Iran may be transferred abroad with a three-month notice to the Board upon fulfillment of all outstanding obligations. Payment of legal deductions and the approval of the Board and confirmation of the Minister of Economy and Finance. Therefore, the Foreign Investor will be entitled to transfer in hard currency both the earned dividends of the investment as well as the principal amount imported into Iran. |
|||||||||||||||||||||||||||||||||||||||||||||||||||||||||||||||||||||||||||||||||||||||||||||||||||||||
|
|
|||||||||||||||||||||||||||||||||||||||||||||||||||||||||||||||||||||||||||||||||||||||||||||||||||||||